| John Favaro | Shari Lawrence Pfleeger |
| Intecs Sistemi | Systems/Software, Inc. |
| Pisa, Italy | Washington, DC, USA |
| [email protected] | [email protected] |
The difference between the two perspetives, technical value and business
value, is easy to see when you raise the issue with executives of major
companies. For example, Steve Andriole, chief information officer for
insurance giant Cigna Corporation, says:
We measure the quality [of our software] by the obvious metrics: up versus down time, maintenance costs, costs connected with modification, and the like. In other owrds, we manage development based on operational performance within cost parameters. HOW the vendor provides cost-effective performance is less of a concern than the results of the effort. ... The issue of business versus technical value is near and dear to our heart -- and one [on] which we focus a great deal of attention. I guess I am surprised to learn that companies would contract with companies for their technical value, at the relative expense of business value. if anything, we err on the other side! If there is not clear (expected) business value (expressed quantitatively: number of claims processed, etc.) then we can't launch a systems project. We take very seriously the "purposeful" requirement phase of the project, when we ask: "why do we want this system?" and "why do we care?" [Andriole 1996]Thus, we must take a hard look at how software engineering developers and managers make decisions about technology investment. We may be misleading ourselves into thinking that our improvements in technical quality are always good for the businesses we are in.
However, Judith Brodman and Donna Johnson took a closer look at the buisness value of process improvement. Surveying 33 companies that performed some kind of process improvement activites, Brodman and Johnson asked about return-on-investment (ROI), a concept that is clearly-defined in the business community. The textbook definition, derived from the financial community, describes investment in terms of what is given up for other purposes. That is, the "investment must not only return the original capital but enough more to at least equal what the funds would have earned elsewhere, plus an allowance for risk." [Putnam and Myers 1992] Usually, the business community uses one of three models to assess ROI: a payback mdel, an accounting rate-of-return model, and a discounted cash flow model.
Brodman and Johnson found that US goverment and industry interpret ROI in very different ways, each different from the other, and both different from the standard business-school approaches. The goverment expresses ROI in dollars, looking at reducing operating costs, predicting dollar savings, and calculating the cost of introducing and employing new technologies or process improvement initiatives.
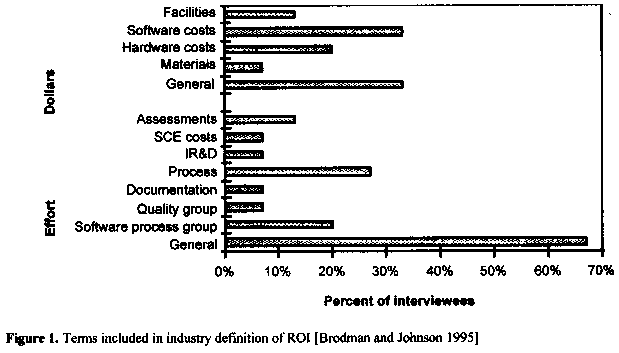
On the other hand, industry views investment as effort. That is, companies are interested in saving time or using fewer people, and their ROI reflects decreasing effort. The surveyed companies calculated ROI using training, schedule, risk, quality, productivity, process, customer and costs. In particular, "costs" included meeting cost predictions, improving cost performance, and staying within budget, rather than reducing operating costs or streamlining the project or organization. Figure 1 summarizes the frequency with which many organizations included an item in its definition of ROI effort calculation, and approximately 35% included software costs when considering number of dollars invested.[Brodman and Johnson 1995]
The difference in views is distrubing, because it means that calculations of ROI are incomparable across organizations. But there are good reasons for these differing views. Dollar savings from reduced schedule, higher quality and increased productivity are returned to the government rather than the contractor. On the other hand, contractors are usually looking for a competitive edge and increased work capacity as well as greater profit; thus, the contractor's ROI is more effort- than cost-based. In particular, more accurate cost and schedule estimation can mean customer satisfaction and repeat business. And decreased time to market as well as improved product quality, are perceived as offering business value, too.
Even though the different ROI calculations can be justified for each organization, it is worrying that software technology ROI is not the same as financial ROI. At some point, program success must be reported to higher levels of management, many of which are related not to software but to the main company business, such as telecommunications or banking. Confusion will result from using the same terminolgy to mean vastly different things. Our success criteria must make sense not only for software projects and processes, but also for the more general business practices they support.
The US Software Engineering Institute (SEI), as promoters of the
Capability Maturity Model, have also undertaken an investigation of the
effects of process improvement. Jim Herbsleb and his colleagues
collected data from 13 organizations representing various levels of
capability maturity. By examining the changes in performance over time
as software process improvement activites were implemented, the research
team identified benefits in productivity, early defect detection, time
to market, and quality. The results are shown in Table 1.
| Category | Range | Median |
| Total yearly cost of software process improvement activities | $49,000 to $1,202,000 | $245,000 |
| Years engaged in software process improvement | 1 to 9 | 3.5 |
| Costs of software process improvement per engineer | $490 to $2004 | $1375 |
| Productivity gain per year | 9% to 67% | 35% |
| Early detection gain per year | 6% to 25% | 22% |
| Yearly reduction in time to market | 15% to 23% | 19% |
| Yearly reduction in post-release defect reports | 10% to 94% | 39% |
| Business value of investment in software process improvement (value returned on each dollar invested) | 4.0 to 8.8 | 5.0 |
Moreover, it is not clear how the reported results should be viewed in the larger context of business value. The "value returned" in the Herbsleb seems to be measured in terms of early detection of defects, reduction in time to market, and reduction of operational failures. But these characteristics do not address customer satisfaction or appropriate functionality. That is, they look at technical quality, rather than business quaility.
Howard Rubin provides two examples that illustrate how an analysis like the SEI's can be misleading. Reviewing the work flow to support software applications at a large US bank. Rubin found that approximately 60% of application enhancement requests given approval in the work prioritization process had no business value at all! In addition, it was taking longer to approve work than to do it, and software applications were almost twice as defect-prone as at other applications was 22% better than others, but the functional quality was 35% worse. In other words, customers saw little benefit from the "improvements" to product quality. [Rubin 1996]
John Seddon delivers the same message in his report on the effects of ISO 9000 on several businesses in the UK. He says that "ISO 9000, because of its implicit theory of quality, will lead to common problems in implementation; problems which damage economic performance and which may inhibit managers from ever learning about quality's potential role in improving productivity and competitive position."[Seddon 1996] Indeed, the UK's Advertising Standards Authority has ruled that the British Standards Institute must refrain from making claims that adherence to ISO 9000 will improve quality and productivity. In a newsletter that describes the case, Seddon notes that "In every case we have studied we have seen ISO 9000 damaging productivity and competitve position. The executives of each and every one of these organisations believed that ISO 9000 had been beneficial: they were all misguided."[ESPI Exchange 1996]
Sometime, businesses consider customer satisfaction as a more appropriate characteristic on which to base investment decisions; the Total Quality Management initiative uses this philosophy, and all businesses understand what customer satisifaction means. As Theodore Levitt of the Harvard Business School points out, "The purpose of business is to create and keep customers."[Levitt 1983] This sentiment is emphasized by Paul Allaire, CEO of Xerox Corporation: "If we do what's right for the customer, our market share and our return on assets will take care of themselves."[Harari 1992]
However, high levels of customer satisfcation can be bad for business. For example, American Airlines is justifiably famous for its pioneering SABRE computerized reservations systems, which has helped American to solidify its leadership in customer service. At the same time, American has consistenly performed well below the Standard and Poor's 500 index. To see how the tension between economic value and customer satisfaction can cause this to happer, consider Figure 2, which illustrates four possible scenarios. In scenario 1, customers are satisfied, and the company is rewarded with good economic returns; the Norton Utilities package is an example of this kind of situation. However, in scenario 2, effort and investment have paid off in customer satisfaction, but diminishing economic returns have been insufficient to recover the money invested. Unfortunately, there are many situations of this kind in the software development business. For example, the European Advanced Software Technology system was highly praised by satisfied customers for its integrated software development facilities. But the prohibitive cost of producing and maintainging the system led eventually to the demise of the company.
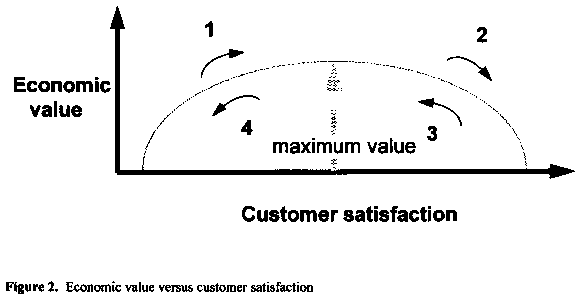
When a project moves from position 1 to position 2, it has overshot its objectives; it is effectively subsidizing the customer by providing more than the customer is paying for. In the long run, the only recourse is to move back up the curve. In scenario 3, the company provides this better balance between price and value, usually by removing features that do not overly penalize customer satisfaction. This "lite" version of the full-blown product can often increase volume, and overall profit rises. For example, the Next system, acknowledged as one of the most innovative workstation environments on the market, was nearly put out of business until the company released a software-only version that eliminated the customer's investment in proprietary Next hardware.
Sometimes, the company underestimates the product's value to the customer. In this case, raising the price can move the product back up the curve, often increasing customer satisfaction at the same time. For instance, in the battle for Internet softwate supremacy, software producers distribute their products at little or no cost to capture a larger share of the market. But when customers complain about congested service centers can slow response time, the companies respond with more costly, elite version accompanied by more personalized customer care.
Alternatively, a company can identify a market niche where customers will pay more for a product that fits their needs. For instance, Tandem computers address business that require fault-tolerance; banks pay a premium for systems that are less likely to fail during an automated teller transaction.
Scenarion 4 illustrates the unfortunate case where low customer satsifaction leads directly to poor economic returns. Many such companies are no longer in business.
These scenarios indicate that customer satisfaction is an inadequate governing objective for investment decisions. Perhaps this is why those who have implemented a Total Quality Management program have been uncomfortable or displeased with the results. Once you implement TQM and create a competitive advantage while lowering your costs, you are still left with critical stategic decisions to make about how to exploit that advantage. These decisons affect not only customer satisfation but also whether you are able to make a profit from your advantage. TQM, by its very nature, is an operational framework; it is not intended to address problems such as pricing policy or market share.
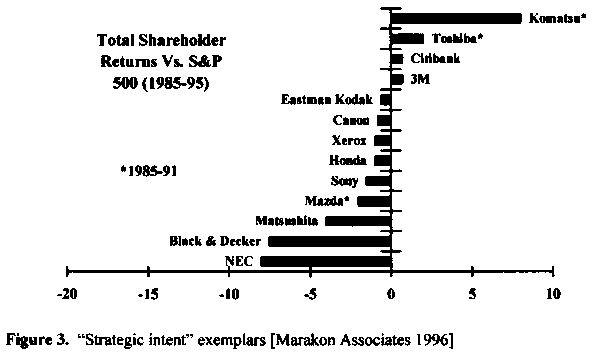
In the software market, the idea of "increasing returns" has become a popular way of explaining success: the "winner" in the race for market share can often set critical standards that then act to lock out other players.[Arthur 1996] In particular, "increasing returns" have been used to explain the extraordinary success of Microsoft. But there are other drivers that have contributed much more to Microsoft's success than increasing returns: the early linkup with IBM; the fateful decision of Apple to remain incompatible; Microsoft's heavy and continous R&D; outlays, continous introduction of new products, and product upgrades, made possible by the peculiarities of software production that allow high returns to coexist with permanent R&D;[Alberts 1996]. In any case, conditions leading to success in specific market sectors cannot always be generalized to the software industry as a whole. Figure 3 shows how several companies have fared financially after embraced the market dominance philosophy over the last decade. Their performance is quite disappointing, relative to the Standard and Poor's 500 index of stocks. Clearly, market leadership does not automatically assure long-term financial success.
However, we cannot stop here. We must decide which investment analysis approach is most appropriate for software-related investment decision-making based on econmic vale. Investment analysis is concerned only with the best way to allocate capital and human resources. Thus, it is distinctly different from cost estimation or metrics; it weighs several alternatives, including the possibility of using capital markets to provide an expected annual rate of return. In other words, from a high-level corporate perpective, management must decide how a proposed technology investment compares with simply letting the money earn interest in the bank!
Not all investment analysis reflects this reality. Taking the perspective of a financial analyst, we must look critically at the most commonly-used approaches: net present value, payback, average return on book value, internal rate of return, and profitability index.
Net present value. NPV expresses economic value in terms of total project life, regardless of scale or time frame. Since investment planning involves spending money in the future, we can think of the present value of an investment as the value today of a predicted future cash flow. The calculation uses a discount rate or opportunity cost, corresponding to the rate of return expected from an equivalent investment in capital markets; this rate may change over tie. Hewlett-Packard uses NPV to evaluate investment in two multi-year corporate reuse projects.
The net present value is the present value of the benefits minus the value of the initial investment. For example, to invest in a new tool, a company may spends money for training and learning time, as well as for the tool itself. The NPV calculation subtracts from the projected benefits these initial investment costs.
The acceptance rule for NPV is simple: invest in a project if its NPV is greater than zero. To see how NPV works, consider the following situation. A company can create a new product line in two ways:
The net present value calculation may resemble Table 2. The COTS alternative has a slightly higher NPV and is therefore preferred.
- Base it on commercial off-the-shelf software. This choice involves a large initial procurement cost, with subsequent high returns (based on avoided work), but the COTS product will be outdated and must be replaced after three years.
- Build the product with a reusable design. The reuse requires considerable up-front costs for design and documentation, but the long-term costs are less than normal.
| Cash flows | COTS | Reuse |
| Initial investment | -9000 | -4000 |
| Year 1 | 5000 | -2000 |
| Year 2 | 6000 | 2000 |
| Year 3 | 7000 | 4500 |
| Year 4 | -4000 | 6000 |
| Sum of all cash flows | 5000 | 6500 |
| NPV at 15% | 2200 | 2162 |
Payback. Payback--the time required to recovevr the cost of an investment--is perhaps seen more often than any other approach. Intuitively, "payback," "breakeven," or "cost recovery" is very appealing, and managers like to hear when they will get their investment back.
But there are several problems with using this approach for investment analysis. First, the choice of cutoff date is generally subjective. Second, payback is not sensitive to patterns of cash flows--it ignores all cash flows after the cutoff date. And generally the discount rate is not considered: equal weight is given to all cash flows.
To see how payback analysis works, suppose a manager has three choices:
Table 3 shows all choices producing a payback within two years. But the first produces earlier returns than the second; choice 3 produces much higher returns in the last period, resulting in far greater value. The projects's true economic value is not captured by this approach, illustrating the problem of scale. Because the choice of cutoff period affects whether long-lived projects are accepted, payback analysis is an arbitrary and error-prone approach, penalizing forward-looking stategies such as corporate-wide reuse. Payback communicate the worthiness of a project; it is easy to grasp and not encased in details. But it is ad hoc, communicating the results of investment analysis but not making a compelling statement about economic value.
- hiring a programmer who produces benefits at an even rate
- making an equal investment in some components (with slightly delayed returns)
- making a large investment in a reuse program (with larger delayed returns).
| Cash Flows | Choice 1 | Choice 2 | Choice 3 |
| C0 | -2000 | -2000 | -4000 |
| C1 | 1000 | 500 | -1500 |
| C2 | 1000 | 1500 | 5500 |
| C3 | 1000 | 1000 | 6000 |
| Payback | 2 years | 2 years | 2 years |
| NPV at 15% | 283 | 226 | 2799 |
| Year | Gross Book Value of Investment | Cumulative amortization | Net book value of investment |
| Year 0 | 20000 | 0 | 20000 |
| Year 1 | 20000 | 5000 | 15000 |
| Year 2 | 20000 | 10000 | 10000 |
| Year 3 | 20000 | 15000 | 5000 |
| Year 4 | 20000 | 20000 | 0 |
This approach deals with a project's value, but the wrong one: accounting income. Depreciation is a tax related concept, not an investment-related one. The calculation depends not on the amount and timing of the project's projected cash flows, but rather on the choice of depreciation schedule, which might be linear, accelerated, or some other choice made by accountant--and is also constrained by tax laws.
For software-related investments, this approach is especially problematic. Depreciation applies only to capital investment, not operating expenses. A consistent policy must be developed for deciding what is capital investment (capitalized) and what is operating expenses (expensed). In software development, this categorization can be a difficult and subjective task--and is likely to be determined by an accountant.
Depreciation leads quickly to "accounting distortions." Several concepts (such as economic depreciation and economic value added ) adjust for some distortions that arise in ongoing project monitorin, but they are not used in the investment decision itself.
Internal Rate of Return. A bond or promissory note produces a
yield at maturity. The internal rate of return generalizes this
notion, calculating a single rate of return for any long-lived project
producing cash flows over multiple time periods. However, this approach
is not sufficiently robust for "industrial-strength" software
development investment analysis, because the calculation requires
well-behaved patterns of cash flows associated with relatively tame
investment instruments (like Treasury Bonds). Real software development
projects are much wilder, producing arbitary patterns of positive and
negative cash flows during their lifetime. IRR becomes more fickle and
error-prone when applied to software investment analysis. Table 5 shows
how alternating cycles of development and maintenance could produce
alternating positive and negative cash flows.
| C0 | +1000 |
| C1 | -3600 |
| C2 | +4320 |
| C3 | -1728 |
| IRR in percent | +20 |
| NPV at 10 percent | -0.75 |
Profitability Index. The ratio of "benefits" to "costs," also known as the profitability index, is popular and intuitively appealing. But, like payback, this approach suffers from problems of sale. A project earning a 100% return on a $1000 investment has double the profitability index of a project earning only a 50% return on a $4000 investment. Yet it yields only half the economic value. In the extreme case, a manager would have only to eliminate all projects except the most profitable to look good to upper management. As with payback, the profitability index is useful primarily for communicating the results of investment analysis in a less rigorous and more intuitively immediate manner than a discounted cash flow analysis.
The theory and application of NPV. Table 6 summarizes the
characteristics of the different approaches discussed above,
highlighting the superioity of NPV over the others. In a real-world
practice, NPV is not used for naive single-project evaluation, but
rather in the context of a comprehensive financial and strategic
framework such as Value-Based Management, in which portfolios of related
projects are constantly monitored and re-evaluated as strategic options
and competitive pressures arise [Favaro 1996]. Interestingly, current
research is extending the NPV approach to information technology
investments with concepts from options pricing theory [Moad 1995] to
model strategic considerations (such as flexibility and staged development) in a more formal way. As these models
are validated, we can expect them to be absorbed into mainstream management practices over the coming years.
| Approach | Issues |
| Net present value Rule: |
|
| Payback Rule: |
|
| Average return on book value Rule: |
|
| Internal rate of return Rule: |
|
| Profitability index Rule: |
|